Understanding Confusion Matrix by CHIRAG
What Is a Confusion Matrix?
- A confusion matrix is a performance evaluation tool in machine learning, representing the accuracy of a classification model.
- It displays the number of true positives, true negatives, false positives, and false negatives.
- A Confusion matrix is an N x N matrix used for evaluating the performance of a classification model, where N is the total number of target classes.
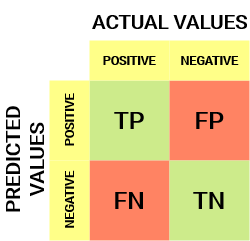
For a binary classification problem, we would have a 2 x 2 matrix, as shown below, with 4 values:

Let’s understanding this matrix:
- The target variable has two values: 0 & 1
- The columns represent the Predicted values of the target variable
- The rows represent the Actual values of the target variable.
True Positive (TP)
- The predicted value matches the actual value, or the predicted class matches the actual class.
- The actual value was positive, and the model predicted a positive value.
True Negative (TN)
- The predicted value matches the actual value, or the predicted class matches the actual class.
- The actual value was negative, and the model predicted a negative value.
False Positive (FP) – Type I Error
- The predicted value was falsely predicted.
- The actual value was negative, but the model predicted a positive value.
- Also known as the type I error.
False Negative (FN) – Type II Error
- The predicted value was falsely predicted.
- The actual value was positive, but the model predicted a negative value.
- Also known as the type II error.
We have a total of 20 cats and dogs and our model predicts whether it is a cat or not.
Actual values = [‘dog’, ‘cat’, ‘dog’, ‘cat’, ‘dog’, ‘dog’, ‘cat’, ‘dog’, ‘cat’, ‘dog’, ‘dog’, ‘dog’, ‘dog’, ‘cat’, ‘dog’, ‘dog’, ‘cat’, ‘dog’, ‘dog’, ‘cat’]
Predicted values = [‘dog’, ‘dog’, ‘dog’, ‘cat’, ‘dog’, ‘dog’, ‘cat’, ‘cat’, ‘cat’, ‘cat’, ‘dog’, ‘dog’, ‘dog’, ‘cat’, ‘dog’, ‘dog’, ‘cat’, ‘dog’, ‘dog’, ‘cat’]

True Positive (TP) = 6
You predicted positive and it’s true. You predicted that an animal is a cat and it actually is.
True Negative (TN) = 11
You predicted negative and it’s true. You predicted that animal is not a cat and it actually is not (it’s a dog).
False Positive (Type 1 Error) (FP) = 2
You predicted positive and it’s false. You predicted that animal is a cat but it actually is not (it’s a dog).
False Negative (Type 2 Error) (FN) = 1
You predicted negative and it’s false. You predicted that animal is not a cat but it actually is.
2. Classification Measure
Basically, it is an extended version of the confusion matrix. There are measures other than the confusion matrix which can help achieve better understanding and analysis of our model and its performance.
Why Use Confusion Matrix?
The confusion Matrix allows us to measure Recall and Precision, which, along with Accuracy and the AUC-ROC curve, are the metrics used to measure the performance of ML models.
Accuracy, Precision, Recall (TPR, Sensitivity), F1-Score, FPR (Type I Error), FNR (Type II Error)
What Are Precision and Recall?
In pattern recognition, object detection, and classification task(ML), precision and recall are performance metrics that use to retrieve data from training data.
Precision (positive predicted) is the fraction of relevant data among the retrieved data. On the other hand, recall (sensitivity) is the fraction of relevant data that were retrieved. Both precision and recall are based on relevance.
What Is F1-Score?
In practice, when we try to increase the precision of our model, the recall goes down, and vice-versa. The F1-score captures both the trends in a single value:

F1-score is a harmonic mean of Precision and Recall, and so it gives a combined idea about these two metrics. It is maximum when Precision is equal to Recall.
But there is a catch here. The interpretability of the F1-score is poor. This means that we don’t know what our classifier is maximizing – precision or recall. So, we use it in combination with other evaluation metrics which gives us a complete picture of the result.
The F1 score is the weighted average of precision and recall. In both precision and recall, there is false positive and false negative, so it also considers both. F1 score is more useful than accuracy, especially when you have an uneven class distribution.


Comments
Post a Comment